Book an intro callIntro call

Ordering on experience and last month's Excel list. A forecast that is right more often.
Whether the forecast lives in the ERP, in Excel or in the planner's head, the question is how often it is right. We put a model on your own sales history next to how you forecast today, and the improvement is on the table before there is a quote. It means less stock of slow movers and fewer lost sales on fast movers.
No obligation, under NDA. No improvement, no cost.
- Forecast accuracy, up from 40% (our case)
- 86%
- Products in the backtest
- 1,247
- Upfront cost
- €0
- Backtest to readout
- 4-6 wk
- GDPR & EU cloud
- NDA first
- Works alongside your ERP and Excel
Standard software, or a model on your data
Standard forecasting software is built for thousands of companies at once. We spend all of our effort on one dataset: yours. The same measurement, on your own history.
40% to 86% accuracy over 1,247 products.
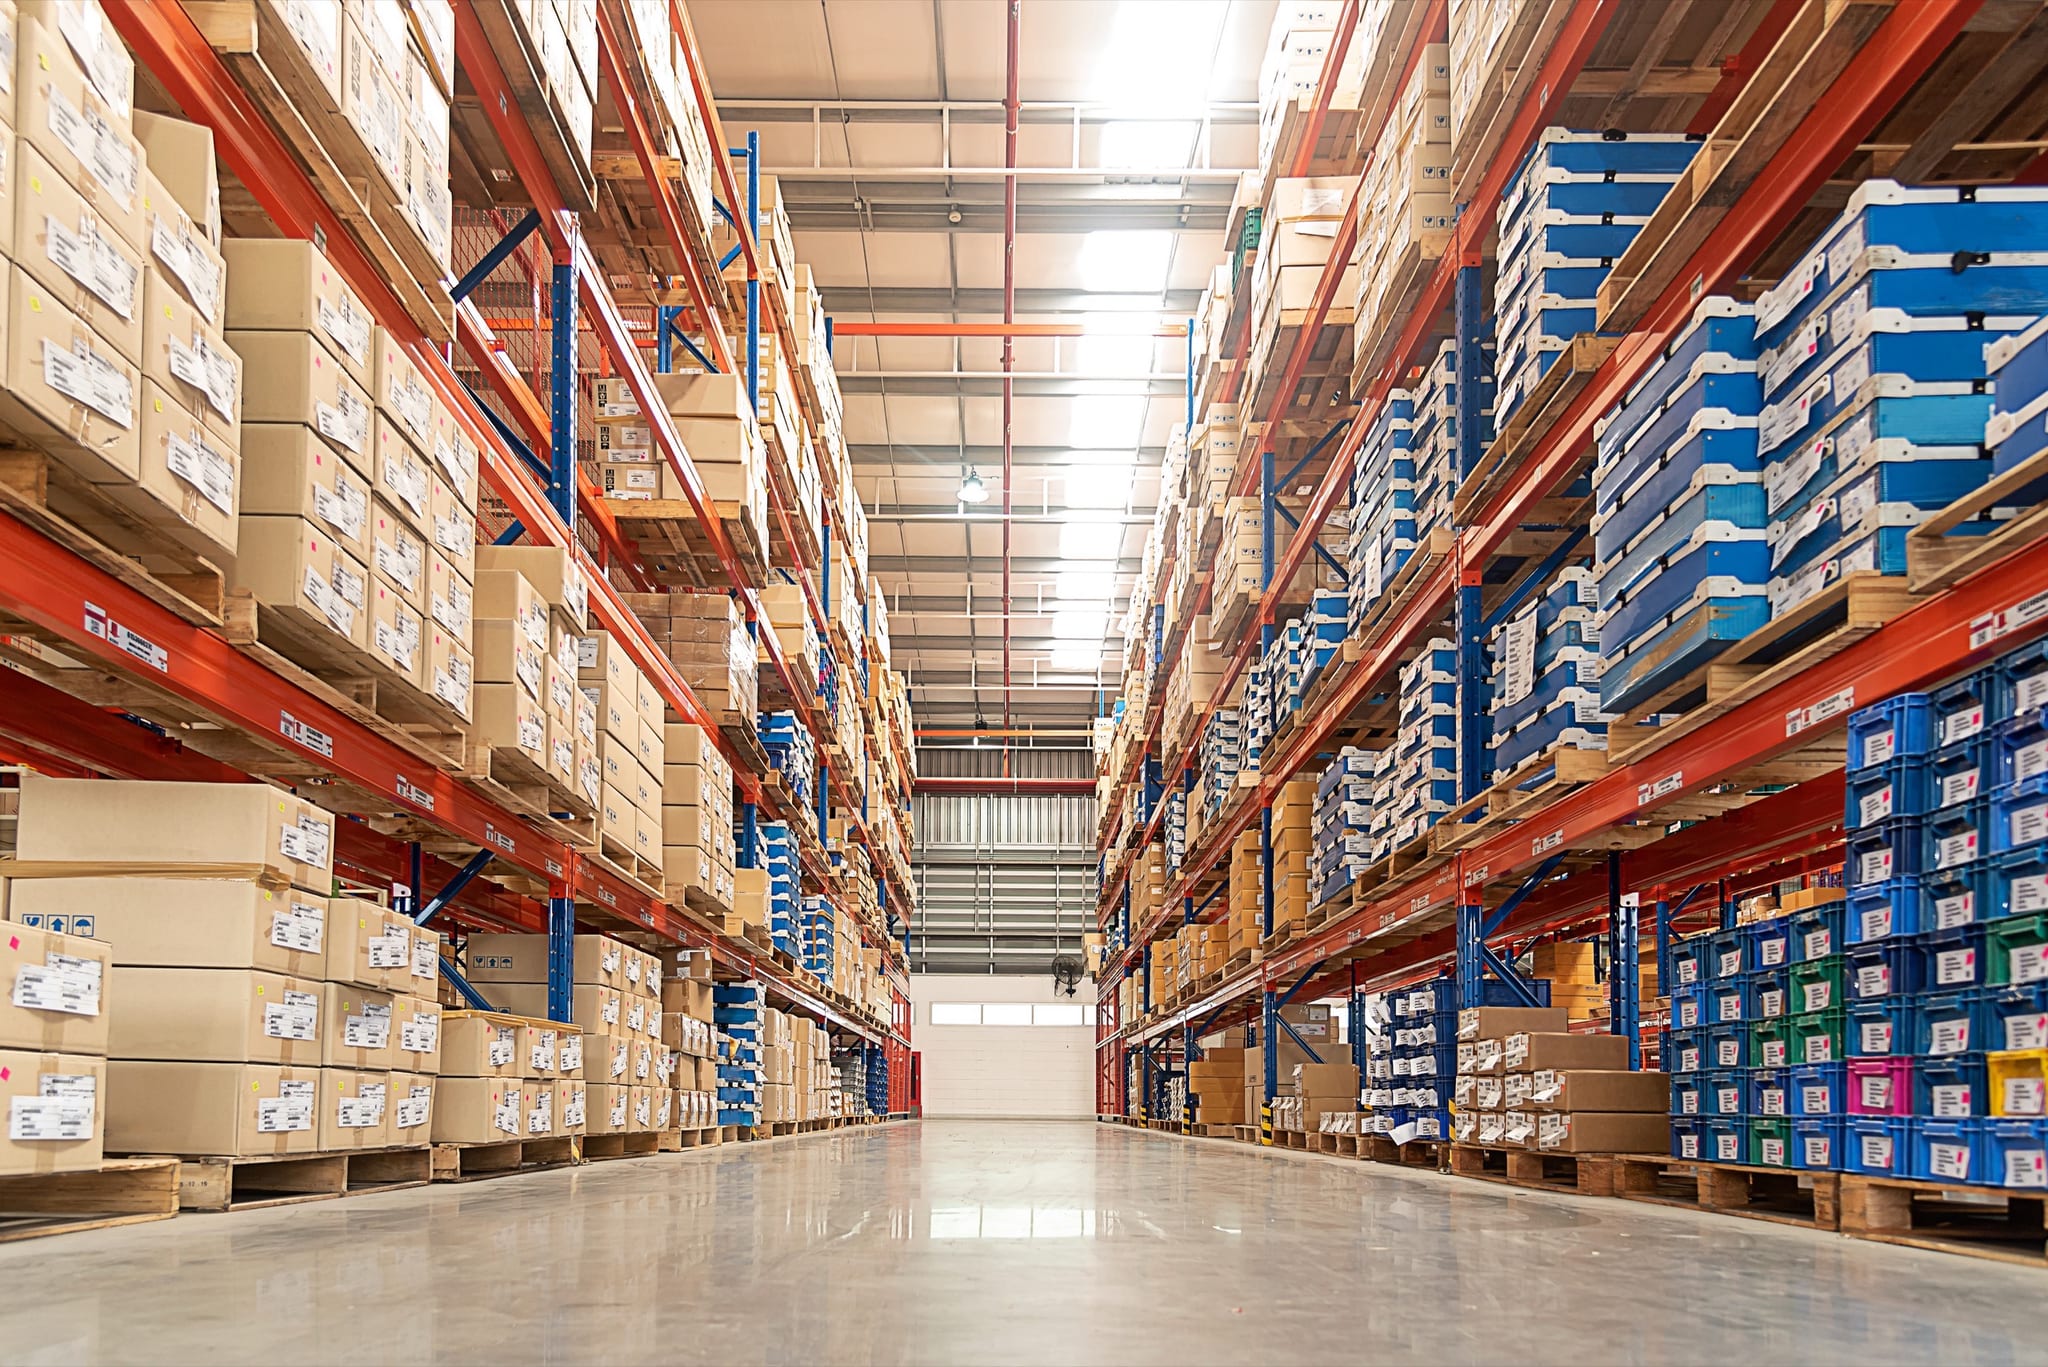
Every pallet bought too early is working capital standing still.
Better forecasts mean less stock, fewer stock-outs and more margin.
Secure, and on your terms
NDA first
We sign an NDA before you share anything.
Your data stays yours
Processed in an EU cloud, GDPR-compliant. We never train on it.
No system access
Only your actuals and current forecast. No ERP connection, SKUs may be anonymised.
Only then comes the no-obligation analysis.
The analysis: proof before you pay
Two years of sales history and the order or forecast that went with it, nothing more is needed. The model forecasts a period it has not seen; we put that next to what was actually sold and next to how you forecast today. That is the backtest. The difference is on the table per product group, and only a pre-agreed threshold leads to a quote. If not, no cost.
Want a rough number before you send anything? Our free calculator shows what a better forecast means for stock and lost sales.
A standard model, or a model on your data
Standard forecasting software automatically picks a calculation method that works for the average company. Fine for the average SKU. We build a model that learns from your own sales data instead: your seasonality, your product mix, and the effect of your own promotions and peaks.
The model also covers slow movers and new products, where standard methods break down, and stays explainable: the planner sees what a forecast is based on and has the final say. We do not replace your software; we raise the accuracy of the forecast, and prove it first on your own history.
Proof, and it fits the systems you already run
A market leader in construction tools had no history for new products. Forecast accuracy rose from 40% to 86% (more than doubled), tested across 1,247 products. Your ERP and planning systems stay as they are; the model runs alongside, with no risk to what works today. Read the case.
At Masparts, a trader in exclusive car parts, a model predicts with 84% accuracy which quotes turn into an order, so sales follows up the likeliest first. Read the case.
How does it work?
- 1
Intro call: 30 minutes, no obligation
Together we set which products, how far ahead and which improvement is worth the effort. No data shared yet.
- 2
Data under NDA
You send two years of sales history and the forecast that went with it. No system access, item numbers may be anonymised.
- 3
Backtest & readout
The model forecasts a period it has not seen, and the difference with how you forecast today is shown per product group. Numbers first.
- 4
Decision
Beat the agreed threshold and a quote follows. If not, no cost, no further ask.
The Data Impact Scan
Curious what this looks like on your data?
Book an intro call with the solution architect who also builds the work. You walk through your processes together and get an honest answer on where the numbers are for you, and where they are not.
30 minutes, no obligation, directly with the builder.
Frequently asked questions
What does this cost, and what if you don't beat my forecast?
We agree a threshold upfront, for example a number of accuracy percentage points. If we don't clear it, there is no cost and no next step. Only once that threshold is cleared does a quote follow.
What data do you need, and is it secure?
Two years of sales history and the order or forecast that went with it. Nothing more: no system access, no integration. Transfer under NDA over a secure connection, item numbers may be anonymised. We process in an EU cloud, GDPR-compliant, and never train on your data.
What does this ask of our team, and what if our data is messy?
Supply the history, we handle the rest. Whether the data is usable shows in the first step: if months are missing or item numbers are duplicated, we say so upfront and look at what can still be done. If there is nothing to gain, there is no proposal.
How do you measure the improvement?
The model forecasts a period it has not seen. We put that next to what was actually sold, next to the forecast that was in place then and next to a simple rule of thumb (next month equals last month). By product group, because a single blended number says too little: the gain often sits in slow movers and new products.
We already use forecasting or planning software. Are you replacing that?
No. Standard software auto-selects a calculation method that works for the average company. Our model sits alongside it, built on your own history, and gains where a percentage point of error costs the most. You migrate nothing; the new forecast goes back to your ERP or to Excel, as today.
What makes your approach strong?
The data scientist who builds the model sits at the table. The model is tuned to your own data rather than one off-the-shelf approach, accounts for promotions, seasonality and new products, and stays explainable: the planner sees what a forecast is based on and has the final say.
Show us how you order today. We'll show you the difference.