Analytics
Building Real-Time Dashboards: From Streaming Data to Live Insights
Published:
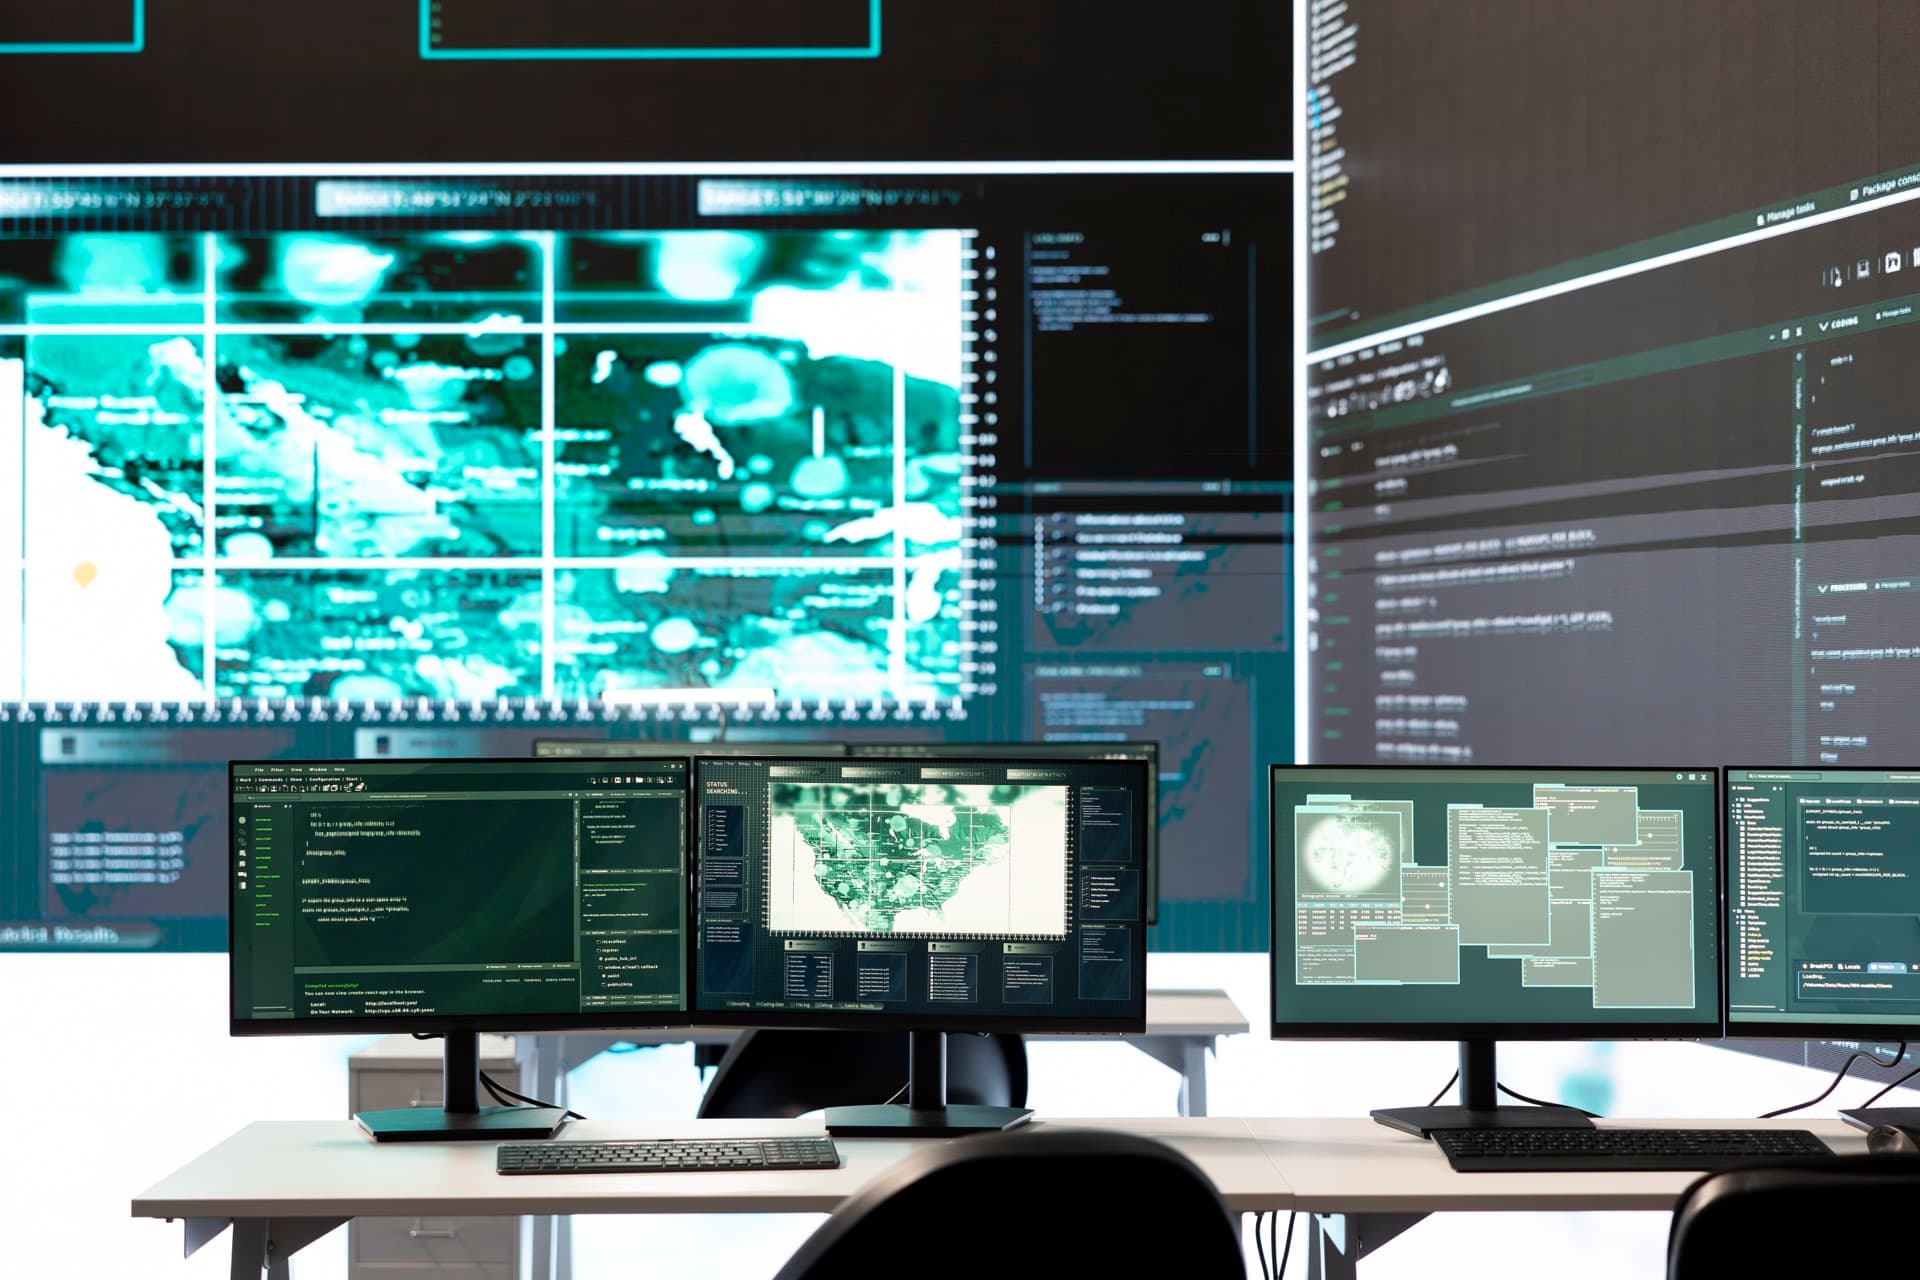
Key Takeaways: Companies with real-time dashboards make decisions 36% faster than organizations working with daily or weekly reports. The investment for an SME ranges from EUR 8,000 for a basic real-time dashboard to EUR 80,000 for a fully integrated platform with streaming analytics. This article guides you from architecture selection to implementation, with honest cost estimates and practical technology choices.
A real-time dashboard is only valuable when it shows the right data to the right person at the right moment, otherwise it is an expensive screen with moving numbers
The difference between a static report and a real-time dashboard is not merely the refresh frequency. It is a fundamentally different approach to decision-making. Static reports tell you what happened. Real-time dashboards tell you what is happening now, enabling you to intervene before a problem escalates rather than measuring the damage afterwards.
Research from Aberdeen Group shows that companies using real-time analytics perform 65% better on customer satisfaction and respond 34% faster to market changes than companies relying on periodic reports. For sectors such as e-commerce, logistics and manufacturing, that difference separates market leadership from falling behind.
Yet not every company benefits from real-time data. The added value depends on two factors: the speed at which your business environment changes and the cost of a delayed response. A retailer processing thousands of transactions per hour during peak days needs real-time insight to adjust inventory and reallocate marketing budget. A consultancy executing monthly projects benefits more from a well-designed weekly dashboard. The key is honestly determining where real-time genuinely adds value and where it amounts to nothing more than a technological prestige project.
The architecture of a real-time dashboard
A real-time dashboard consists of four layers, each serving a specific function. The data collection layer retrieves data from source systems. The streaming layer processes and routes that data in real time. The storage layer preserves data for analysis. The visualization layer presents data to users. The design of each layer determines the performance, reliability and cost of the whole.
The data collection layer must be able to pick up data at the moment an event occurs. This differs fundamentally from traditional ETL processes that retrieve data in batches. There are three approaches. Event-driven architecture publishes every transaction, mouse click or sensor reading as an individual event to a message broker. Change Data Capture (CDC) monitors databases for changes and forwards only the deltas. Webhook integrations receive push notifications from external systems when something changes.
For the streaming layer, Apache Kafka and Amazon Kinesis are the two dominant technologies. Kafka is open source, extremely scalable and processes millions of events per second. However, the complexity of management makes it less suitable for SMEs unless you opt for a managed service like Confluent Cloud (from EUR 250 per month) or Amazon MSK (from EUR 200 per month). Amazon Kinesis is fully managed and simpler to set up, with costs from EUR 50 per month for typical SME volumes.
An increasingly popular alternative for SMEs is skipping the streaming layer entirely and instead working with frequently refreshing queries. Materialized views in PostgreSQL or BigQuery refresh data every 30 to 60 seconds, which for many business applications is sufficiently "real-time." Costs are significantly lower, typically EUR 100 to 300 per month, and complexity is a fraction of a full streaming architecture.
Technology choices for SMEs
The tool selection for your real-time dashboard depends on your existing technology stack, the desired refresh rate and the available budget. For SMEs, there are three realistic paths, each with its own cost-benefit ratio.
The first path is a cloud-native approach using Google BigQuery as data warehouse, Looker Studio or an embedded analytics tool for visualization and scheduled queries refreshing every minute. Costs amount to EUR 200 to 600 per month and the refresh rate is one to five minutes. This path suits companies already in the Google ecosystem where a delay of several minutes is acceptable. According to a Google Cloud analysis, 78% of SMEs on their platform use this approach for their first real-time dashboards.
The second path combines a real-time database such as Apache Druid or ClickHouse with a visualization tool like Grafana or Apache Superset. Costs amount to EUR 400 to 1,200 per month and the refresh rate is five to thirty seconds. This path offers considerably better performance for complex aggregations on large datasets and is the better choice when you process millions of rows per day.
The third path is a full streaming architecture with Kafka or Kinesis, a stream processing engine like Apache Flink or ksqlDB and a real-time visualization layer. Costs amount to EUR 1,000 to 3,000 per month and the refresh rate is sub-second. This path is only justified for companies where every second of delay costs money directly, such as high-frequency trading, live advertising optimization or industrial process monitoring.
From design to implementation in five phases
Implementing a real-time dashboard follows five phases, each with its own timeline and budget. A structured approach prevents the most common pitfall: a technically impressive dashboard that nobody uses because it answers the wrong questions.
Phase one is the discovery phase, where you determine which KPIs and metrics require real-time insight. Involve the actual users in this phase, not just management. A warehouse manager has different real-time needs than a marketing director. Timeline is one to two weeks and costs EUR 1,000 to 3,000 with external guidance.
Phase two is architecture design, where you select the technology stack, map out data flows and dimension the infrastructure. This is where you choose between the three paths from the previous section. Timeline is one to two weeks and costs EUR 2,000 to 5,000.
Phase three is the data integration phase, where you build connections to source systems and set up the data pipeline. This is typically the most labour-intensive phase. On average, 40% of total project time goes to data integration, primarily due to unexpected complexity in source systems. Timeline is three to six weeks and costs EUR 3,000 to 20,000, depending on the number of sources.
Phase four is dashboard development, where you build visualizations, design interactions and optimize the user experience. A common mistake in this phase is showing too much data. Research from Nielsen Norman Group shows that dashboards with more than seven to nine visual elements increase cognitive load to the point where users make less effective decisions. Limit each dashboard screen to the five most important metrics and provide drill-down capabilities for detail. Timeline is two to four weeks and costs EUR 2,000 to 10,000.
Phase five is the testing and rollout phase, where you validate the dashboard with real data, train users and process feedback. Plan at least two weeks for this phase and accept that the first version will not be the final one. The best dashboards evolve based on usage feedback in the first three months after launch.
Common mistakes and how to avoid them
The three most destructive mistakes with real-time dashboards cost not only money but also internal trust in data initiatives. The first mistake is showing real-time data without context. A number that is currently 347 tells you nothing if you do not know whether that is good or bad. Every real-time number needs benchmarks: a comparison with yesterday, last week or the same moment last year. Without that context, real-time data leads to panic during normal fluctuations and missed signals during genuine anomalies.
The second mistake is confusing data freshness with data quality. A dashboard that refreshes every second but shows incorrect data is worse than a weekly report with reliable figures. Invest in data validation in your pipeline: check for missing values, unrealistic outliers and synchronization issues between sources. Research from TDWI shows that organizations spend an average of 50% of their time resolving data quality issues in real-time systems.
The third mistake is building for today without accounting for tomorrow. Real-time dashboards grow organically: new sources, new metrics, more users. Design your architecture modularly so you can add sources without rebuilding the whole. Choose tools that scale horizontally and avoid hard-coded connections between components.
Real-time dashboards by sector
The value of real-time data differs fundamentally by sector and it is important to align your expectations with your specific business context. In the e-commerce sector, real-time insight into conversion rates, cart abandonment and advertising performance is directly linked to revenue. An online retailer that sees mobile conversion rates drop by 40% during Black Friday can implement a page optimization within minutes that prevents tens of thousands of euros in lost revenue.
In the logistics sector, real-time dashboards provide insight into delivery statuses, vehicle positions and warehouse throughput. Companies with their own distribution report on average 12% lower transport costs after implementing real-time route optimization. The investment in this sector typically pays for itself within six months through lower fuel costs and higher delivery reliability.
The manufacturing industry benefits from real-time OEE monitoring (Overall Equipment Effectiveness) and predictive maintenance dashboards. Unplanned downtime costs manufacturing companies an average of EUR 260,000 per hour according to research from Aberdeen. Even a modest 5% improvement in uptime represents a saving of EUR 100,000 to 300,000 per year for a mid-size manufacturing company.
For professional services, the added value is subtler but no less real. Real-time dashboards showing consultancy hours, project margins and resource utilization enable management teams to course-correct underperforming projects before they become loss-making. Companies in this sector report 8 to 15% higher project margins on average after implementing real-time project monitoring.
Costs and payback period
The total investment for a real-time dashboard depends on the chosen complexity level. A basic real-time dashboard with two to three sources and minute-level refresh costs EUR 8,000 to 20,000 in development and EUR 200 to 600 per month operationally. An advanced dashboard with five to eight sources and second-level refresh costs EUR 20,000 to 50,000 in development and EUR 500 to 1,500 per month. A full streaming platform with ten or more sources and sub-second refresh costs EUR 50,000 to 80,000 in development and EUR 1,500 to 3,000 per month.
Payback period varies by use case but typical scenarios show returns within eight to fourteen months. An e-commerce company that advertises 15% more efficiently thanks to real-time insight into advertising performance on an annual media budget of EUR 200,000 saves EUR 30,000 per year. A manufacturing company that reduces downtime by 20% through real-time monitoring of production lines saves substantially at an average downtime cost of EUR 500 per hour.
The WBSO subsidy also applies to the development of real-time dashboards that contain technically innovative elements, such as custom streaming architectures or advanced anomaly detection algorithms. The average tax benefit of 32% on development costs significantly shortens the payback period. For projects with AI components, such as predictive alerts in dashboards, the AInnovate subsidy offers additional funding up to 50% of project costs.
Getting started with real-time: a pragmatic approach
The most successful real-time dashboards start small. Choose a use case where the business impact of faster information is concrete and measurable, build an initial version in four to six weeks, measure the effect and expand once the value is established. The technology is mature, costs are predictable and tools are more accessible than ever. What remains is the choice to begin.
A pragmatic first step is identifying a decision you regularly make too late. If you discover every Monday that a product sold out last week, real-time inventory monitoring is your starting point. If you only see at the end of the month that a marketing campaign is underperforming, real-time campaign tracking is your first project. The best dashboards are not born from technological ambition but from operational frustration. They answer the question you keep asking too late, only now at the moment when the answer still matters. Want to know which real-time insights would deliver the most value for your business? Get in touch for a no-obligation consultation where we map out your opportunities together.
Get the AI-subsidy radar
1 email per month. New subsidies, deadlines, and what changed for SMEs. 5-minute read.
Unsubscribe with one click. No spam, ever.
Keep reading
Related articles

Analytics
Data Visualization for Business: Best Practices for Better Decisions
Learn how to choose the right chart type, design dashboards that drive action, and avoid misleading visuals, with practical comparisons of Power BI, Tableau, and Looker.
Read more →
Analytics
Setting Up a Marketing Attribution Model: From Last-Click to Data-Driven
Learn how to set up a marketing attribution model that goes beyond last-click, so you truly understand which channels drive conversions and can optimise your budget allocation with data.
Read more →

Analytics
Predicting customer churn with AI: how to keep your customers
With churn prediction, an SME forecasts which customers are at risk of leaving, so you can retain them proactively. Here is how it works and what it delivers.
Read more →

Let's talk business
Do you want to know how we can help you grow your business? Schedule free consultation with one of our experts and discover the possibilities.