Book an intro callIntro call

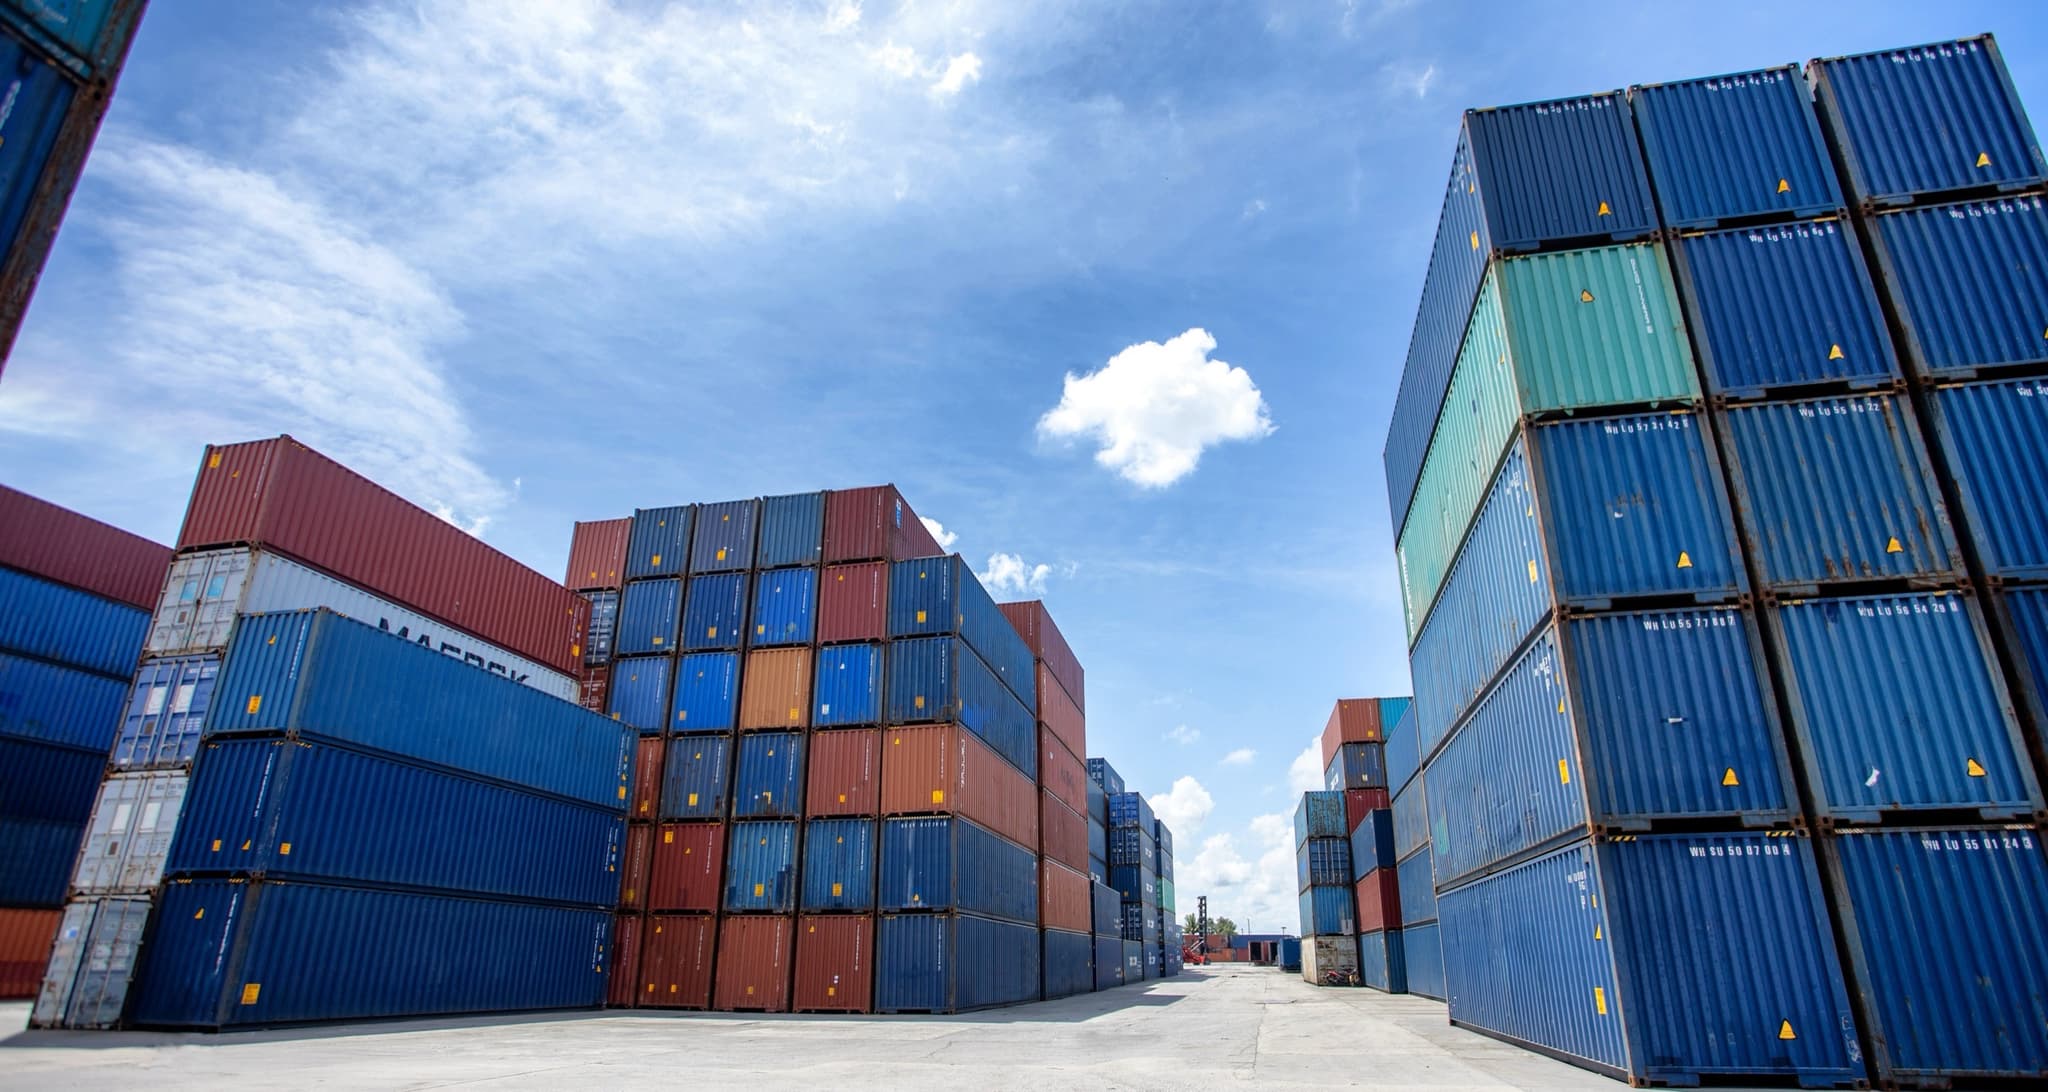


Four solutions for the work that is still done by hand or in Excel.
For manufacturing, wholesale and logistics companies with 20 to 250 people. Every solution runs on your own data and connects to what is already there, such as Exact, AFAS, SAP Business One or an industry package. The first step is a thirty-minute conversation, no obligation.
Every bottleneck has its own solution.
Pick what hurts most. The first conversation often shows that one solution needs another, and then we say so.
Automating orders and work
Orders from email, PDF and Excel are ready as a draft order in the ERP. The retyping goes away, the team checks every order and keeps the decision.
At a wholesaler: 2 out of 3 order emails without typingMore on automationDemand forecasting and planning
Purchasing, stock and capacity on a forecast tested on the company's own sales data, with purchase proposals and warnings for shortages or surplus.
At an international manufacturer: forecast from 40% to 86% accurateMore on forecastingData foundation and integrations
Systems that talk to each other and one place where the numbers add up. Often the hidden blocker for everything else.
At a web shop: the discount per month in viewMore on the data foundationCustom systems
A planning board, order portal or shop-floor app next to the ERP already in place, built on the same process. Sometimes a complete ERP that follows the way the business works.
Built next to or on top of the existing ERPMore on custom systemsFor those who already know where it sits.
- Order processing automationOrders from email and PDF as draft orders in the TMS or ERP.
- Document processingInvoices, packing slips and forms read and checked.
- CMR and waybillsPaper waybills digital, linked to the trip.
- Putting an existing model to useA prototype or model that already exists, reliable in the daily work.
- Calculate it yourselfCalculators for forecast, stock and manual work.
What a solution changes in the work.
Which technique fits follows from the problem and from the data that is there, not the other way round.
Knowing what will be ordered
A model that forecasts from the company's own sales history what will be asked for: per product, per customer, per period. Purchasing and planning then work from a number instead of experience.
- Demand per product and per period
- Warnings for shortages or surplus
- Customers who are starting to order less
- Seasonal patterns and trends
Emails and documents that read themselves in
Order emails, PDFs and Excel lists are read and prepared as a draft order. The team checks the exceptions and keeps the decision.
- Orders from email, PDF and Excel
- Invoices and packing slips
- Doubtful cases set aside for an employee
- Spotting deviations in orders
Seeing where the margin is
Which customer still pays off, which product sells, which channel works. Figures and knowledge of the trade together, so decisions rest on figures.
- Margin per customer and product
- Return per sales channel
- What a price or promotion change did
- Which customers are growing and which are leaving
Systems that talk to each other
The connections and one place where the figures from all systems come together, so reports and models run on current data. It runs next to the ERP already in place.
- One overview instead of five systems and Excel
- Dashboards with current figures (Power BI, Tableau)
- Connections with ERP, web shop and CRM
- Reports that build themselves
What it delivered, measured on own data.
Every number comes from a measurement on the client's own data. For the forecast that is a backtest: the forecast tested on a period from the past. Clients are anonymous unless they gave permission.
- 86% forecast accuracy, against 40% with the old method. That saves CHF 778,000 a year. International manufacturer
- 2 out of 3 order emails nobody has to retype any more: over 3,300 of the 5,017. They are ready as a correct draft order in the ERP. Wholesaler, measured September 2026
- 30 days of discounts in one view, from systems that used to stand apart. D2C web shop, NL and DE
- 6.1x higher hit rate at the top of the call list than the old calling order. Training institute, 632 leads tested, pilot
From a first conversation to a solution that runs, in four steps.
- 1
Data Impact Scan
A thirty-minute conversation about the systems and the data you have, no obligation. The result is an overview of the opportunities.
- 2
Feasibility and ROI
For each opportunity we work out on your own history what it is worth, with a backtest. If the outcome is thin, it stops here, without a proposal. If the data is messy, we see that here too.
- 3
Building in sprints
Every two weeks something works, tested on your own data. Knowledge transfer runs along with every sprint.
- 4
Delivery and continuity
Documentation, training and monitoring. The code belongs to the company, and after that the team runs it, with us as a safety net.
Practical guides on data, AI and subsidies
Hand-picked deep-dives on the questions manufacturers, wholesalers and logistics companies ask most often.
AI & implementation
Subsidies & financing
Data foundation & cost
Document processing & automation
What we build with.
We connect to the systems you already run. Behind them we build with common, open tooling that your own team or a next partner knows too. Which tools we pick depends on the problem.
The toolbox40 tools in 6 groups
Systems we connect to
ERP, web shop and CRM. We pull the data out and put the result back in.
- Exact OnlineERP
- AFASERP and HR
- Dynamics 365ERP and CRM
- SAP Business One
- Odoo
- Shopify
- WooCommerce
- HubSpot
Data and storage
One place where the numbers from all those systems come together and add up.
- PostgreSQL
 MongoDB
- Snowflake
- Databricks
 Microsoft Fabric
- Google BigQuery
- DuckDB
- dbt
Models and AI
Forecasts, classification and reading emails and documents.
- Python
 R
- pandas
- NumPy
- scikit-learn
- PyTorch
 TensorFlow
- MLflow
Integrations and automation
Flows that run on their own every night or every minute, with an alert when something breaks.
- Apache Airflow
- Apache Spark
- Apache Kafka
- n8n
- FastAPI
- Jupyter
Dashboards and reporting
Where the team sees the outcome every day.
- Power BI
 Tableau
- Grafana
Cloud and operations
Runs in the cloud that suits you, version-controlled and reproducible.
- Microsoft Azure
- Amazon Web Services
- Google Cloud
- Docker
- Kubernetes
- Terraform
- GitHub
Before the first conversation.
How do we know whether data and AI will deliver for us?
We always start with a Data Impact Scan and a feasibility check on the company's own data. In it we test whether there is really something to gain, before anything is invested. If there is nothing to gain, we say so honestly and stop. Investment only happens once it is clear what it delivers.
What does working together look like?
Every project starts with a no‑obligation conversation about the situation. Then follows a proposal with the ROI calculation attached, so it is clear upfront what it is expected to deliver.
How long does a typical project take?
Most projects run 6‑12 weeks from start to production. We work in two‑week sprints, so after two weeks something already works. Every sprint delivers something the team can work with, and knowledge transfer runs along.
How does pricing work, hours or results?
A fixed price for exploration and build. On the right projects a results component comes on top, tied to a measurement agreed up front, such as the number of order emails that no longer need retyping. We agree the baseline and measurement method upfront, so it is fair and verifiable for both sides.