 Book an intro callIntro call




Consumption, generation and maintenance
Energy and utilities
Supply and demand in balance, fewer outages and grid losses that stand out in time. From a forecast of consumption and generation to maintenance on the grid before something breaks.
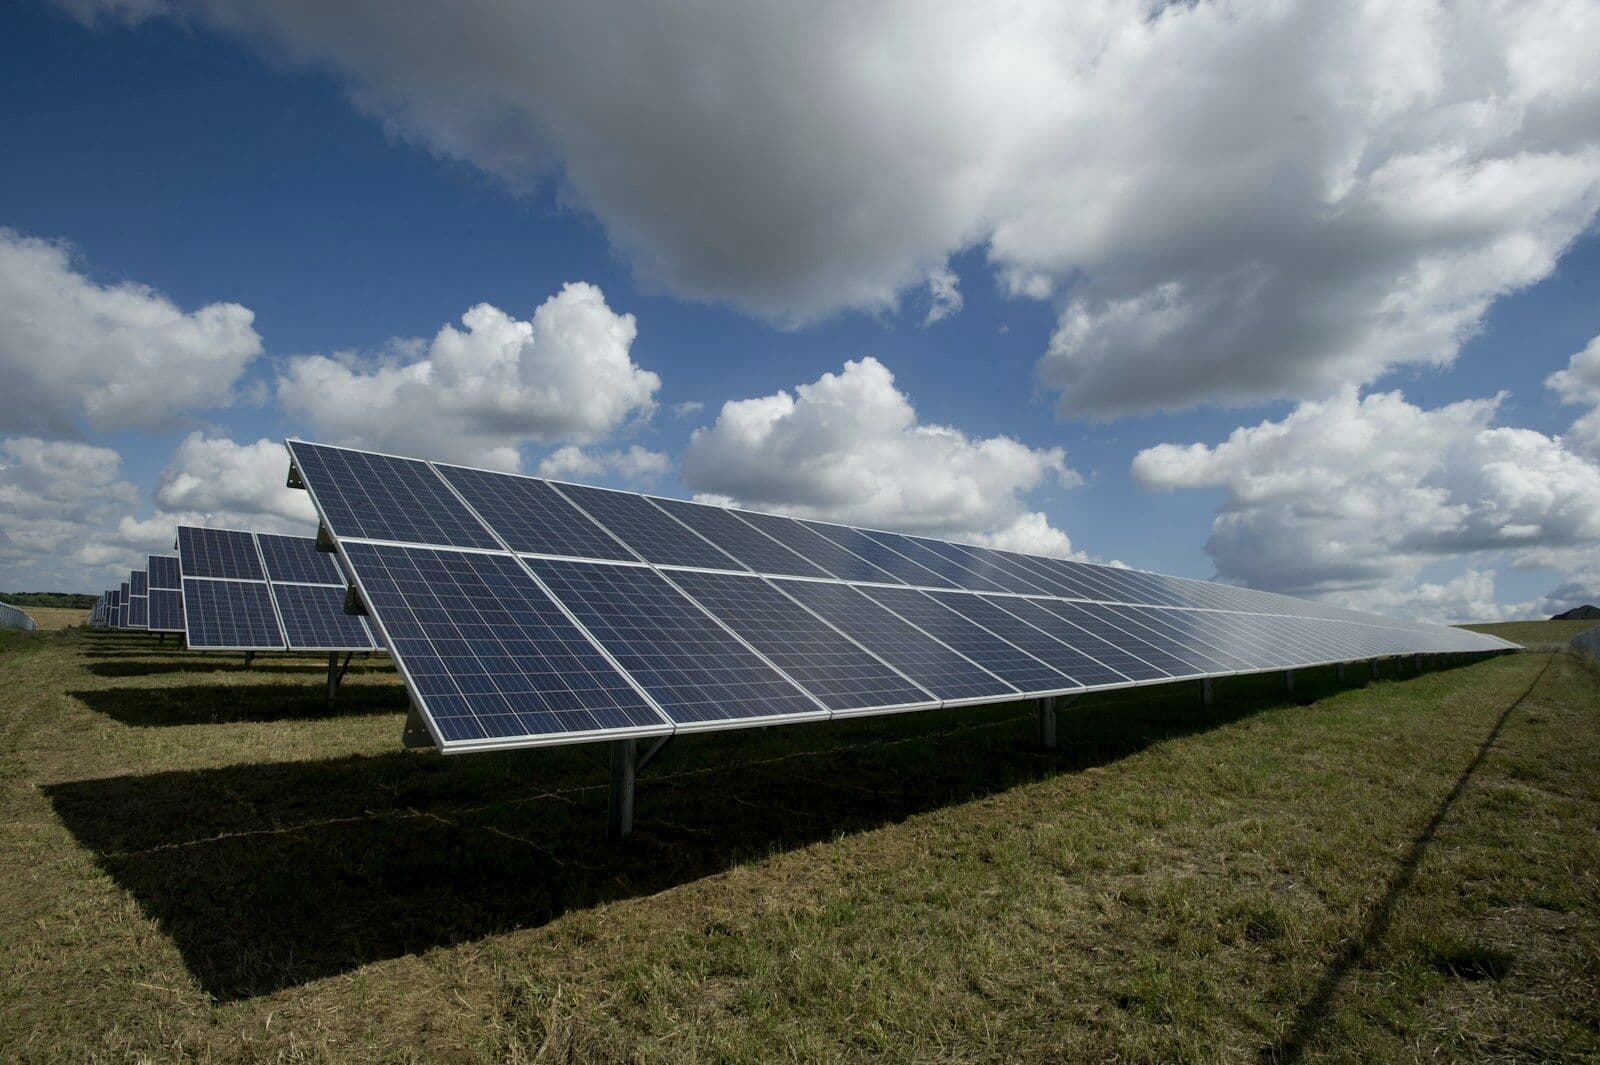
- 30%Lower forecast error on demand
- 40%Fewer unplanned outages
- 24/7Deviations flagged straight away
Three places where the sector gets stuck
- 01
Forecasting consumption and generation
Imbalance between supply and demand is expensive and risky. A forecast on weather, season and history shows consumption and generation more accurately, down to the hour.
- 02
Maintenance on the grid
Failure of critical installations disrupts supply. Maintenance on a forecast from sensor and SCADA data sees faults coming early.
- 03
Grid losses and unusual consumption
Losses and unusual consumption often go unnoticed. A model that follows the grid continuously spots patterns that fixed rules miss.
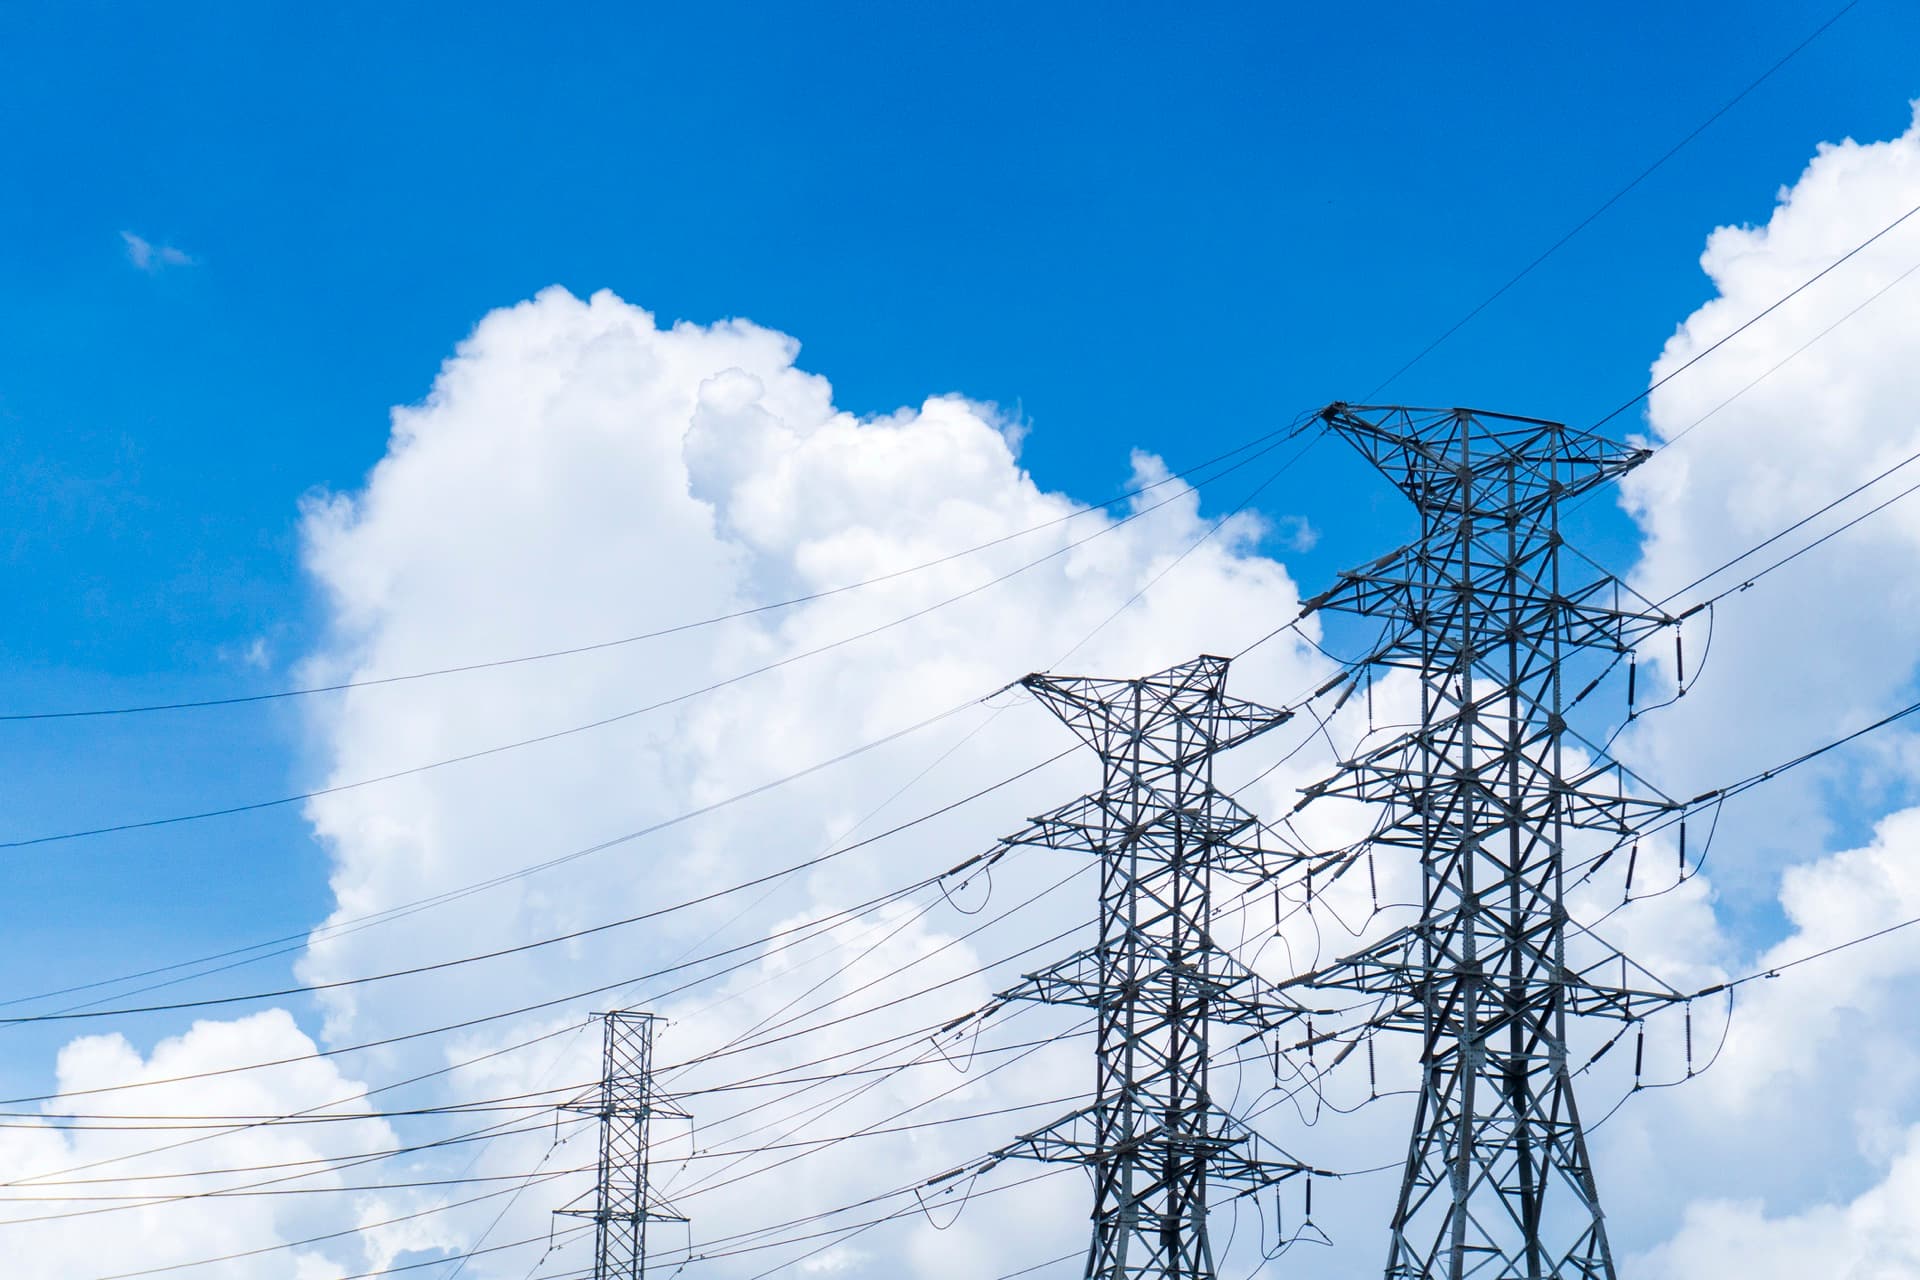
Built on the company's own data and connected to what already runs
- 01
Demand forecasting for energy
Consumption and generation forecast with models that combine weather, season and market data.
- Forecast per hour and per day
- Weather and season weighed in
- Generation from sun and wind
- Portfolio in balance
- 02
Maintenance before it goes wrong
Seeing failure of grid components and installations coming, based on sensor and SCADA data.
- Condition tracked
- Alert on unusual behaviour
- How long an installation will last
- Maintenance scheduled on the forecast
- 03
Tracing losses and deviations
Seeing grid losses, fraud and unusual consumption as soon as they happen.
- Consumption profiles
- Links within the grid
- Score per connection
- Fewer losses
The Data Impact Scan
Curious what this looks like on your data?
Book an intro call with the solution architect who also builds the work. You walk through your processes together and get an honest answer on where the numbers are for you, and where they are not.
30 minutes, no obligation, directly with the builder.